DerbyX DerbyX:
I'm not going to call fraud on that article just yet, but some things caught my eye in that article, and I was wondering if you could explain them to me.
$1:
The latest Arctic sea ice data from NASA and the National Snow and Ice Data Center
OK, now we all, of course remember the satellite NSIDC uses was corrupted for "almost 2 months", as reported in February of this year right? The data might still be in use for all we know, but bloggers started to complain when they noticed craziness like the following in the NSIDC updating sea ice extent graphs.
NSIDC graph with corrupted dataYou can read about it here, if you missed that story.
NSIDC Sea Ice Sensor has Catastrophic FailureAfter that failure was pointed out to them they readjusted the data, and the graph now looks more like this...
NSIDC graph fixed with uncorrupted dataBig difference, eh?
OK, so let's go back to your article for a sec.
$1:
According to researchers from the National Snow and Ice Data Center in Boulder, Colo., the maximum sea ice extent for 2008-09, reached on Feb. 28, was 5.85 million square miles. That is 278,000 square miles less than the average extent for 1979 to 2000.
My question to you then, is can I trust that? Going by my memory it took more than 10 days to get everything back online in an uncorrupted state.
As I recall they had to borrow data from uncorrupted satellites, or something.
In fact wanna see what those uncorrupted satellites were saying?
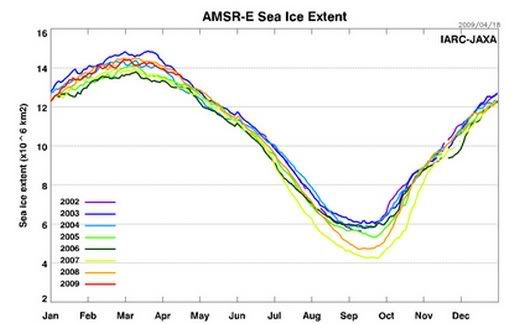
That doesn't necessarily contradict the basic gist of what the NASA article was saying. However there's some interesting observations to made in that graph. It's true arctic sea ice extent was declining in a short term trend at least up until 2007. 2007 was an ice extent minimum record for the 30 years of the satellite record. The year after that Ice extent bounced back a bit for the month of the arctic minimum, and for all of 2008 the increase was significant. If you look at where 2009 is right now you'll see it's tied with 2008, and I personally am willing to bet there will also be another increase for the fall minimum in September of 2009. That will be a 2 year increase from the minimum.
Wanna see another one?
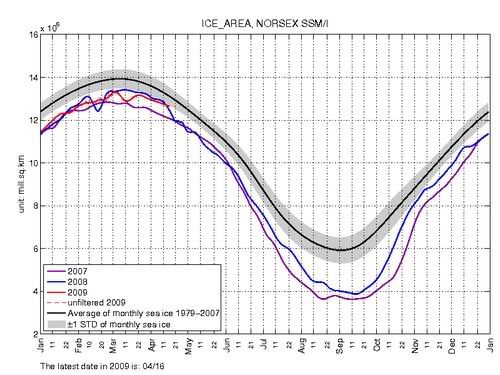
Notice how 2009 is going into the error bars for the 1979 to 2007 average?
Here's some other cool stuff you might want to take note of.
Arctic temperatures have been cooling since 2005.So if it wasn't warmer, CO2 driven temperatures that caused the 2007 sea ice extent minimum, what was it?
Here's one suspect. It's mentioned in one of the articles linked to earlier.
The WindThere are, as I said other suspects - currents, salinity, record arctic cloudlessness in 2007, soot, even underwater volcanic activity. Most likely a combination of all those.
BTW did you know there's a lot of anecdotal, and other evidence this recent arctic melt was probably not unprecedented before the satellite period?
Here's a news article from 1946There's hard data suggesting arctic ice may be thickening this yearYou don't know that though, because the media, and AGWist flavored sites have a way of twisting words.
Here's an exampleBut hey, thanks for the link. Although I'm not sure what it has to due with the subject of this thread, which concerns how the Antarctic ice is growing, not shrinking.
BTW, did you know if you put North, and South together on a graph, sea ice globally is static? I have a link here somewhere for that, if you want it.


") CKA Uber
CKA Uber 
![[B-o]](./images/smilies/drinkup.gif "Drink up")